Setting Up Envoy AI Gateway to Monitor Claude Usage
Observability used to be mostly about system health—CPU, latency, and error rates. In the age of LLMs, that’s only part of the story. Understanding usage, tracking costs, and evaluating output quality have become just as important as monitoring infrastructure performance.
The gap is not visibility — it is meaning.
In a conventional microservices system:
- errors are explicit (5xx, timeouts)
- performance regressions are measurable (CPU, DB latency)
- success is binary (request succeeded or failed)
With LLM systems:
- responses can be technically successful but semantically wrong
- latency can be acceptable but token cost silently increases
- outputs can degrade in quality without triggering any alerts
- different models behave inconsistently under identical prompts
This is the core limitation of traditional observability in AI systems.
In this article, “observability” refers primarily to operational visibility into LLM traffic, usage, latency, and telemetry. Evaluating response quality and model correctness requires additional tooling and processes.
An AI Gateway is a proxy layer that sits between applications and LLM providers (such as AWS Bedrock, OpenAI, Anthropic, or self-hosted models).
Envoy AI Gateway provides a centralized control point for AI traffic, similar to how API gateways are used for traditional application traffic.
By placing a gateway between applications and providers, teams gain a consistent layer for routing, governance, security, resiliency, and observability without requiring changes in every client.
Applications interact with the gateway instead of directly integrating with individual LLM providers.
This creates a consistent interface for:
- Amazon Bedrock
- Azure Open AI
- GCP Vertex AI
- other supported providers
Clients can remain unchanged while models or providers evolve behind the gateway.
The gateway becomes the decision point for where requests are sent.
Common use cases include:
- model-based routing
- fallback between providers
- traffic splitting
- canary deployments for new models
- multi-provider architectures
This allows routing policies to be managed centrally instead of being implemented separately in every application.
AI traffic often requires controls beyond basic API access.
Envoy AI Gateway enables centralized enforcement of:
- authentication and authorization
- rate limiting
- quota management
- retry policies
- timeout policies
- organizational guardrails
Policies can be applied consistently across all AI consumers regardless of the client being used.
Envoy AI Gateway integrates naturally into cloud-native environments.
- Kubernetes deployment and scaling
- GitOps-friendly configuration
- integration with existing platform engineering workflows
For teams already operating Kubernetes platforms, the gateway fits into established operational patterns.
Observability is one outcome of centralizing AI traffic through a gateway.
Because requests pass through a common control point, teams can analyze:
- request volume
- model usage
- latency trends
- token consumption
- error patterns
- client behavior
Amazon Bedrock already provides metrics through CloudWatch, and for many workloads that may be sufficient.
However, CloudWatch primarily provides visibility into AWS service-level metrics. It does not act as a centralized control point for AI traffic, nor does it provide a provider-agnostic layer when multiple models, tools, or providers are involved.
Envoy AI Gateway sits directly in the request path between clients and LLM providers. Because every request passes through the gateway, it can expose operational data such as:
- request volume
- model usage
- latency
- token consumption
- error rates
- client-specific traffic patterns
This becomes particularly useful when multiple AI clients, applications, or providers are involved. Instead of collecting and correlating metrics from individual tools, visibility is consolidated at the gateway layer.
The objective of this article is not to replace CloudWatch. CloudWatch remains valuable for monitoring AWS infrastructure and Bedrock service metrics.
The goal is to demonstrate how Envoy AI Gateway can provide an additional operational perspective by exposing request-level AI traffic metrics through Prometheus and Grafana.
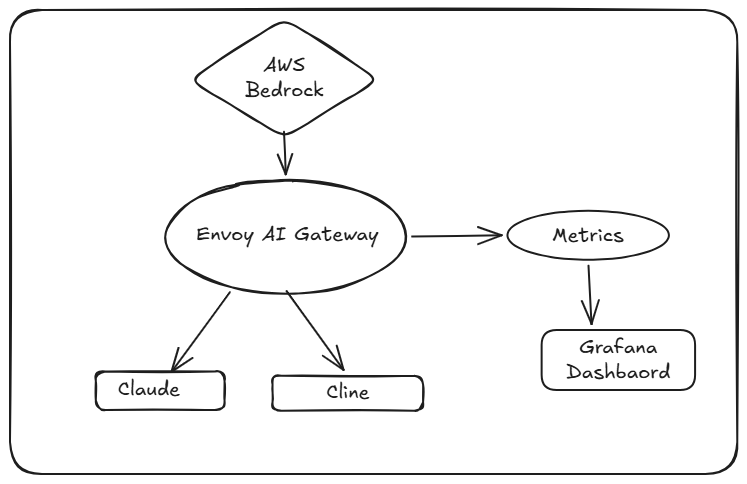
In this lab environment:
- Claude CLI and Cline send requests through Envoy AI Gateway
- Envoy AI Gateway routes requests to Amazon Bedrock
- Prometheus collects gateway metrics
- Grafana visualizes request and usage data
- An AWS account with access to AWS Bedrock.
- A Kubernetes cluster (EKS, GKE, AKS, or Docker Desktop) to deploy the Envoy AI Gateway.
- kubectl configured to access your Kubernetes cluster.
- Basic knowledge of Kubernetes and Envoy Proxy.
- helm installed for deploying the Envoy AI Gateway.
This guide was tested on Kubernetes 1.32. You can create a cluster using EKS, GKE, AKS, or Docker Desktop.
Uninstalling any existing Envoy Gateway deployments before proceeding:
helm uninstall eg -n envoy-gateway-systemkubectl delete namespace envoy-gateway-systemEnvoy AI Gateway is built on top of Envoy Gateway. Install it using Helm and wait for the deployment to be ready.
helm upgrade -i eg oci://docker.io/envoyproxy/gateway-helm \  --version v1.7.2 \  --namespace envoy-gateway-system \  --create-namespace \  -f https://raw.githubusercontent.com/envoyproxy/ai-gateway/main/manifests/envoy-gateway-values.yaml
kubectl wait --timeout=2m -n envoy-gateway-system deployment/envoy-gateway --for=condition=AvailableStep 1: Install AI Gateway CRDs First, install the CRD Helm chart (ai-gateway-crds-helm) which manages all Custom Resource Definitions:
helm upgrade -i aieg-crd oci://docker.io/envoyproxy/ai-gateway-crds-helm \ --version v0.0.5.0 \ --namespace envoy-ai-gateway-system \ --create-namespaceStep 2: Install AI Gateway Resources After the CRDs are installed, install the AI Gateway Helm chart:
helm upgrade -i aieg oci://docker.io/envoyproxy/ai-gateway-helm \  --version v0.5.0 \  --namespace envoy-ai-gateway-system \  --create-namespace
kubectl wait --timeout=2m -n envoy-ai-gateway-system deployment/ai-gateway-controller --for=condition=Available
Verify Installation Check the status of the pods. All pods should be in the Running state with Ready status.
kubectl get pods -n envoy-ai-gateway-systemConnect AWS Bedrock
Prerequisites:
- AWS credentials with access to Bedrock
- Enabled Claude model access in the us-east-1 region (see AWS Bedrock Model Access)
We will use static credentials for this example, but in production, consider using AWS IAM roles for secure credential management. Static credentials are used for demonstration purposes only. Production environments should use an appropriate secret-management solution.
- Download and configure the AWS example manifest:
curl -O https://raw.githubusercontent.com/envoyproxy/ai-gateway/refs/tags/v0.5.0/examples/basic/aws.yaml- Edit “aws.yaml” and replace the credential placeholders:
AWS_ACCESS_KEY_ID: Your AWS access key ID
AWS_SECRET_ACCESS_KEY: Your AWS secret access key
- Apply and test
kubectl apply -f aws.yaml
kubectl wait pods --timeout=2m \-l gateway.envoyproxy.io/owning-gateway-name=envoy-ai-gateway-basic \-n envoy-gateway-system --for=condition=Ready- Test the gateway with a sample request:
export GATEWAY_URL=$(kubectl get gateway envoy-ai-gateway-basic -n default -o jsonpath='{.status.addresses[0].value}')curl -H "Content-Type: application/json" \ -d '{ "model": "anthropic.claude-3-5-sonnet-20241022-v2:0", "messages": [ { "role": "user", "content": "What is capital of France?" } ], "max_tokens": 100 }' \ $GATEWAY_URL/anthropic/v1/messagesExpected output:
{ "id": "msg_01XFDUDYJgAACzvnptvVoYEL", "type": "message", "role": "assistant", "content": [ { "type": "text", "text": "The capital of France is Paris." } ], "model": "claude-3-5-sonnet-20241022", "stop_reason": "end_turn", "usage": { "input_tokens": 13, "output_tokens": 8 }}For more troubleshooting and advanced features, see Envoy AI Documentation (opens in a new window)
Envoy AI Gateway collects metrics and exports them to Prometheus using the OpenTelemetry format. This follows the OpenTelemetry Gen AI Semantic Conventions (opens in a new window).
Apply the monitoring configuration:
kubectl apply -f https://raw.githubusercontent.com/envoyproxy/ai-gateway/main/examples/monitoring/monitoring.yamlWait for the monitoring pods to start, then forward Prometheus locally:
kubectl port-forward -n monitoring svc/prometheus 9090:9090Open “http://localhost:9090 (opens in a new window)” to access the Prometheus dashboard.
You can install Grafana in the cluster using Helm, or run it locally with Docker Desktop for simplicity.
“docker-compose.yaml”
grafana:  image: grafana/grafana-enterprise:10.0.0  container_name: grafana  restart: unless-stopped  ports:    - '3000:3000'  volumes:    - grafana-storage:/var/lib/grafana
volumes: grafana-storage:docker compose up -dNavigate to “http://localhost:3000 (opens in a new window)”.
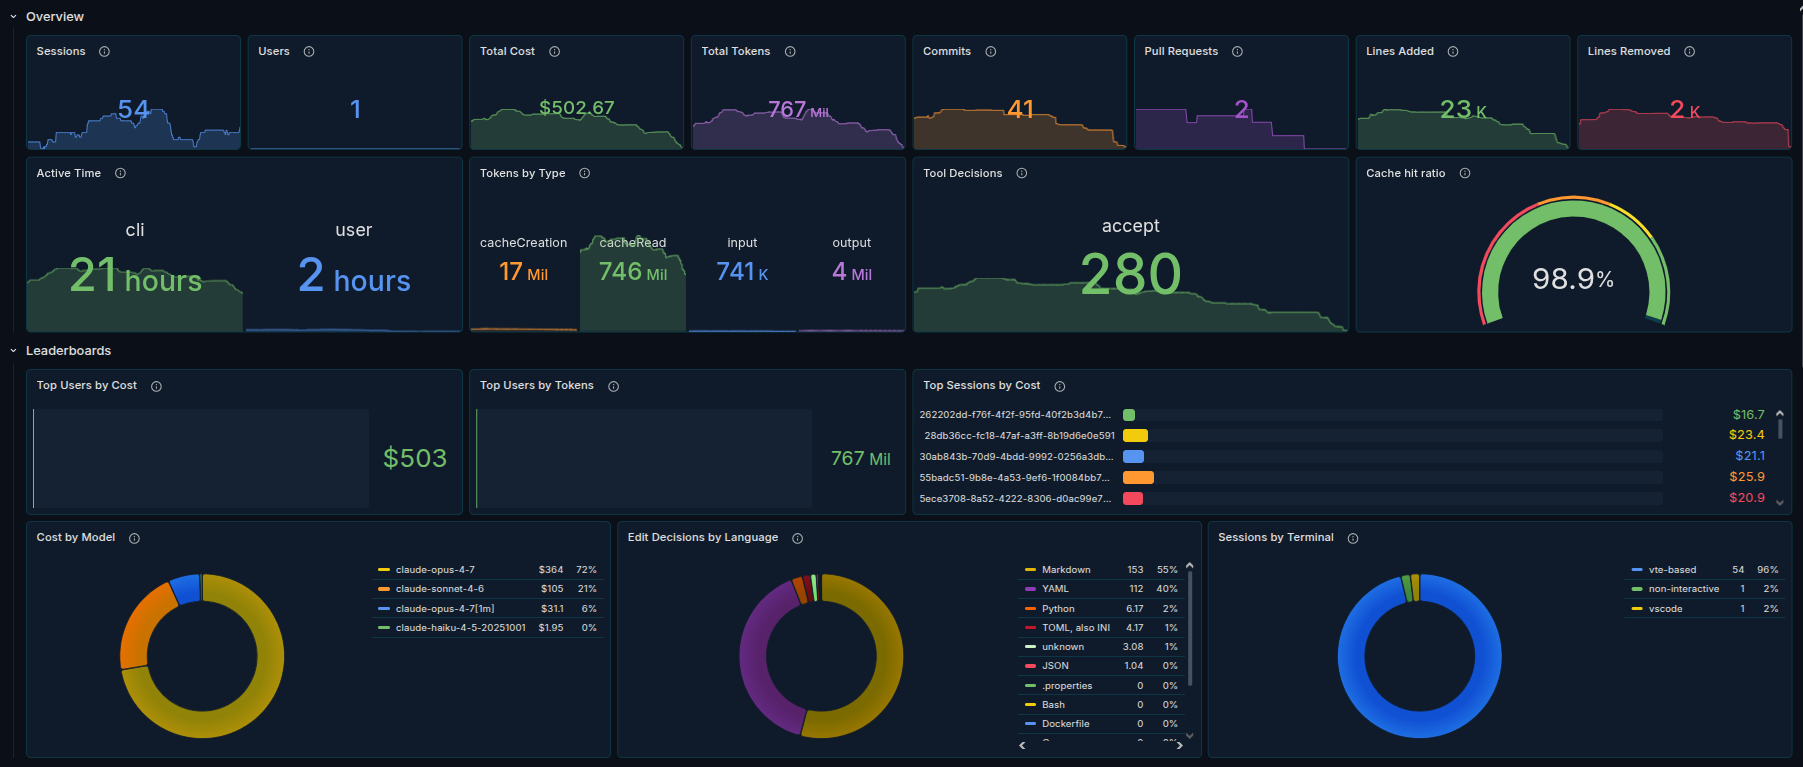
- Add Prometheus as a data source using Connections > Add new connection > Prometheus.
- Run queries in Explore > Prometheus.
- Create a dashboard for Claude by importing an existing Grafana dashboard for claude from here (opens in a new window)
- Request volume by model
- Token consumption trends
- Error rates
- p95 latency
- Provider-specific traffic distribution
- Retry counts
For a production deployment, consider:
- IAM Roles for Service Accounts (IRSA) or AWS role-based access instead of static credentials
- secret management for Bedrock and Anthropic credentials
- authentication and TLS for gateway ingress
- multi-tenant isolation and request policy scoping
- horizontal scaling and HA for Envoy and Prometheus
- stable image tags and version pinning
Use these commands to configure Claude CLI to route through the gateway:
export GATEWAY_URL=$(kubectl get gateway envoy-ai-gateway-basic -n default -o jsonpath='{.status.addresses[0].value}')export ANTHROPIC_BASE_URL=$GATEWAY_URL/anthropicexport ANTHROPIC_API_KEY=""claude --model claude-sonnet-3-5Cline is used as a VS Code extension. Configure it with these settings:
- API Provider: Anthropic
- User Custom Base URL: http://host.internal/anthropic (opens in a new window) (for Docker Desktop)
- Model: claude-sonnet-3-5 (choose your preferred model)
While implementing this setup, I had to make a few adjustments beyond the upstream documentation. Common areas that required attention included:
- AWS credential configuration
- Grafana datasource configuration
- Gateway routing configuration
- Kubernetes permissions
- Header configurations
Envoy AI Gateway operates at the traffic and control layer. It does not evaluate semantic correctness of model outputs.
- Response quality evaluation
- Hallucination detection
- Prompt optimization
- Application debugging
Envoy AI Gateway supports a wide range of capabilities. In this article, we focused on monitoring operational metrics such as request traffic, token usage, cache metrics, latency, and gateway telemetry.
While Anthropic provides its own observability integrations for Claude on its native platform, this setup is designed for Claude models accessed through Amazon Bedrock APIs. The goal here is to demonstrate how Envoy AI Gateway can be used as a centralized monitoring and traffic-management layer in that environment.
Comments
Join the conversation
Add a quick note for other readers. Comments are stored locally in your browser so you can keep track of your thoughts on this post.